In the dynamic realm of Linux administration, unlocking the secrets of system performance is key to sustaining optimal operations. 🛠️ While numerous tools abound, mastering command-line prowess is paramount for swift and effective troubleshooting. In this guide, we unveil the top five Linux commands for performance analysis, complete with step-by-step instructions and captivating screenshots to elevate your expertise.
1. top Command: Harness the power of top to gain real-time insights into system processes. 📊 This command offers a dynamic overview of resource usage, including CPU, memory, and active processes, enabling informed decisions on resource allocation.
Command Screenshot:
 Output Screenshot:
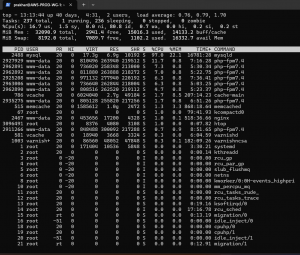
htop Command (Optional): For a more visually appealing alternative to top, consider installing and using htop. 🚀 This interactive process viewer provides a colorful representation of system metrics, making it easier to identify resource-intensive processes.
Installation: Ensure that you have the htop package installed on your Linux system. Use the appropriate package manager for your distribution:
- For Ubuntu/Debian:
sudo apt-get install htop
Command Screenshot: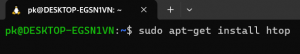
- For CentOS/RHEL:
sudo yum install htopCommand Screenshot: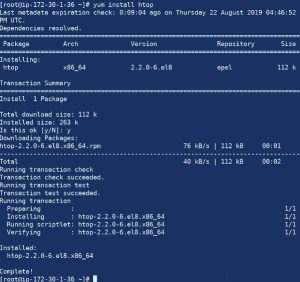
Usage: Once installed, simply run htop from the command line to launch the interactive process viewer.
Output Screenshot:
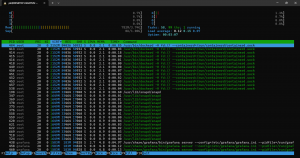
Note: htop provides similar functionality to top but with additional features such as mouse support, scrolling, and process tree navigation. It can be a valuable tool for monitoring system performance in a more user-friendly manner.
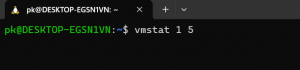
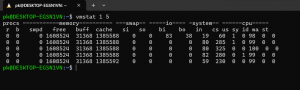
2. vmstat Command: With vmstat, delve into system-wide virtual memory statistics with ease. 🧠 From process information to memory utilization and CPU activity, this command empowers you to pinpoint memory and CPU bottlenecks swiftly.
Command Screenshot:
Output Screenshot:
3. df Command (Disk Space): Keep your storage in check with the df command, a reliable tool for examining disk space usage. 💾 This command provides a clear overview of available disk space, filesystem types, and mount points, allowing you to manage storage efficiently.
Command Screenshot:
 Output Screenshot:
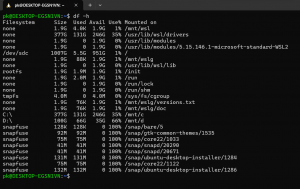
Note: The -h option stands for “human-readable,” displaying sizes in a more understandable format (e.g., KB, MB, GB). By regularly monitoring disk space usage with df, you can prevent storage shortages and ensure smooth system operations.
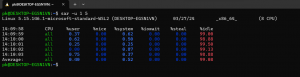
4. sar Command: Leverage the prowess of sar to capture comprehensive system activity metrics. 📈 From CPU and memory utilization to disk and network performance, this command provides a holistic view over a specified time period.
Command Screenshot:
 Output Screenshot:
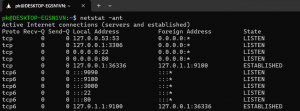
5. netstat Command: Unravel network mysteries with the netstat command. 🌐 This versatile tool offers insights into network connections, routing tables, and interface statistics, aiding in the diagnosis of network-related performance issues.
Command Screenshot:
 Output Screenshot:
Conclusion: Armed with these top five Linux commands for performance analysis, you’re poised to elevate your system administration prowess. 🚀 By monitoring CPU usage, memory utilization, disk activity, and network connections, you can optimize system performance and ensure seamless operations for your Linux environment.
Additional Tips:
- Experiment with various command options to tailor outputs to your specific needs.
- Combine commands using pipes (
|) for advanced performance analysis tasks. - Regularly monitor system performance to preemptively address potential issues and uphold optimal system health.

")
